¶ In the beginning of the COVID-19 pandemic, a joke about “time spent looking at exponential graphs” circulated on social media.
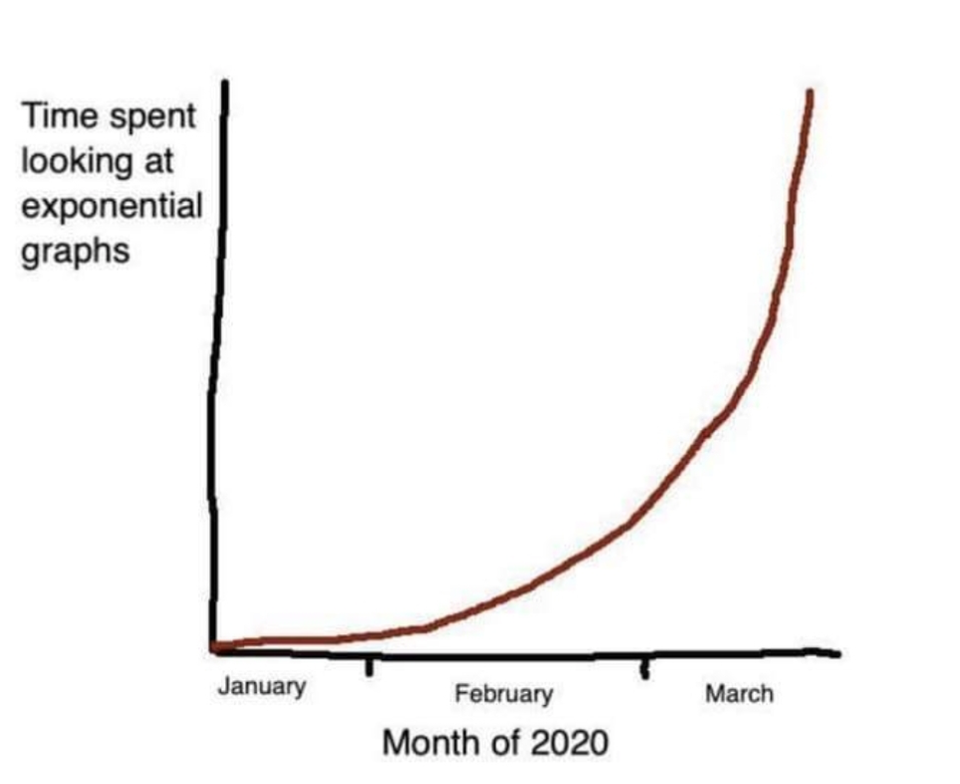
¶ This was surely a time of graphs, charts and curves. Uncertainty made people search for signs, trends and tendencies. Something to hold on to. Credible prognoses. How would it all develop? What could we expect to happen? Would we be able to “flatten the curve” of registered COVID-19 cases and deaths? Would the curve go up, would it go down?
¶ What is this imaginary surfing along curves? Diagrams, charts and graphs. Plots, points and grids. All these abstract representations. Notions of time and some other factor. X- and Y-axes. An imaginary line takes form. It is said to show how something changes over time. Giving direction, capturing the orientation of minds and collectives. Moving, bending, twisting, curving.
¶ A graph can of course have different shapes. A common and widespread version is the S-curve. A shape imagined to show how something changes slightly at the beginning, then how change speeds up exponentially. The curve becomes steeper. Rising towards an imagined top, onward and upwards. Then it gradually becomes almost horisontal. A continued movement towards the right. Moving forward? Progression of time without any notable growth or increase.
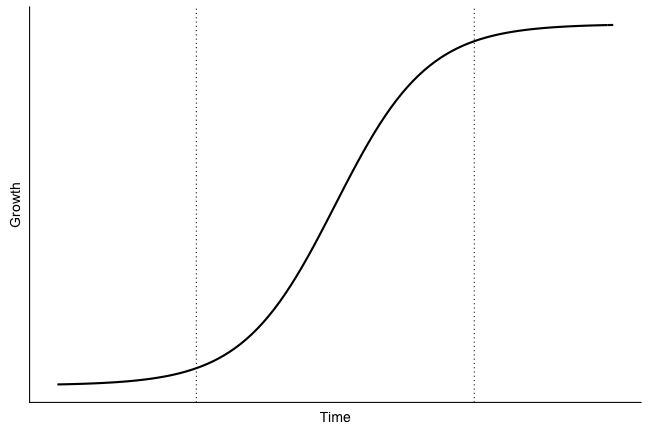
¶ The S-curve has been used to show how innovations are spread, how consumers or user adopt novelties.[1] It pictures how, first a smaller group of early adopters are influenced, starts to use or take on something. It all depends on what is counted, but the shape of the curve is more or less universal. After the early adopters comes the majority. Now the curve becomes steeper. Rising upwards, for good or for bad, depending on what the curve represents and who is looking at it. The majority is followed by laggards, the ones coming in late.
¶ The S-curve has been used to show everything from the dissemination and dispersion of certain tools, like rakes in the Swedish countryside during early 20th Century, to the spread of Internet connectivity around year 2000. Twenty years later curves similar to the S-curve were utilised to illustrate virus infections and the development of the pandemic. Seldom have so much statistics and numbers been transformed to curves and graphs, then projected, disseminated, discussed, used, interpreted and misinterpreted.
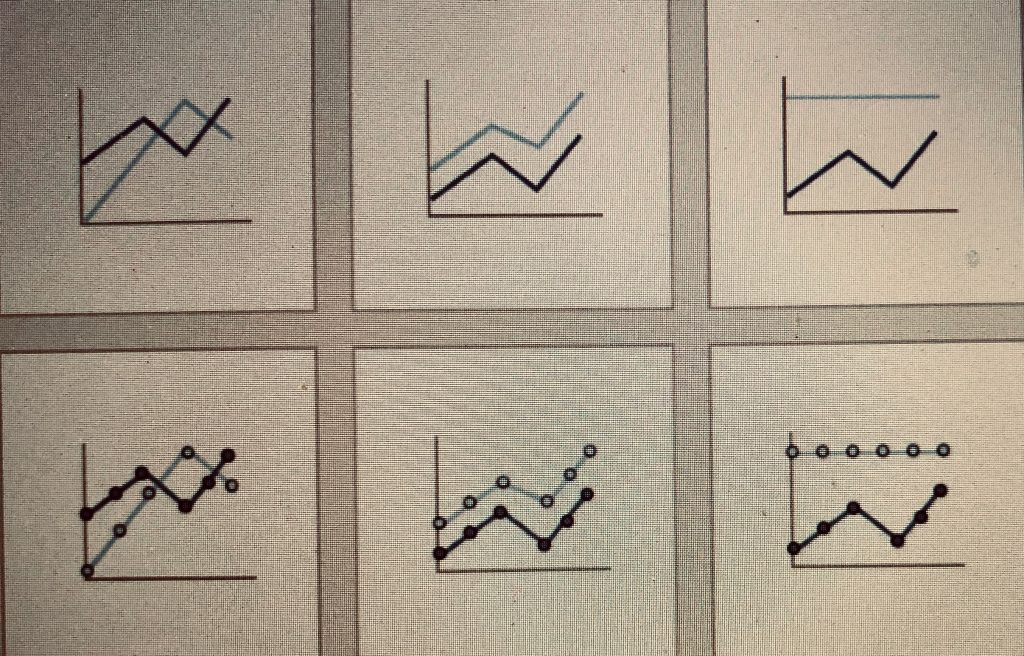
¶ The chart and the curve. Their suggestive power comes from the simplistic imaginaries they evoke. Complex processes and conditions transmuted into visual objects and shapes within the frame of a chart. Organised in a grid. Representing amounts, levels and size. What is off-grid does not exist in this evocation of a demarcated reality. Straightforward and easy to address as supposed evidence and as weapons of argumentation and persuasion.
¶ Also the sequentiality of curves. The progression and an envisaged one-way direction of change. This is how reality is depicted and collectively imagined in many parts of society. In board rooms, in class rooms, at conferences and meetings.
¶ The use of tools and cognitive aids to imagine, communicate and do knowledge work does of course have a long and multi-faceted history. In a review essay of Reviel Netz’ The Shaping of Deduction in Greek Mathematics: A Study in Cognitive History (2003) Bruno Latour stress the importance of scripto-visual inventions and quote Netz:
I will argue that the two main tools for the shaping of deduction were the diagram, on the one hand, and the mathematical language on the other hand. Diagrams – in the specific way they are used in Greek mathematics – are the Greek mathematical way of tapping human visual cognitive resources. Greek mathematical language is a way of tapping human linguistic resources … But note that there is nothing universal about the precise shape of such cognitive methods. They are not neural; they are a historical construct … One need studies in cognitive history, and I offer here one such study. (pp. 6–7)
Reviel Netz’ The Shaping of Deduction in Greek Mathematics: A Study in Cognitive History (pp. 6-7) as quoted in Bruno Latour (2008) Review Essay: The Netz-Works of Greek Deductions. In: Social Studies of Science 38 (pp. 441–459)
¶ Here Netz highlights the diagram as a tool for the shaping of deduction, arguing that practices like, what I here call, curve surfing have been crucial collective cognitive techniques. Latour continue to reflect on Netz´ argument:
As can be seen from this quotation, Netz’s materialism is not to be found as in some ‘social construction of mathematics’ in the economical background of classical Greece, but in the intellectual technologies in which so much of science studies today consists. How do you demonstrate something to someone? That is, how do you show it? How do you draw it? How do you point your finger at it while speaking? How do you letter it? How do you gain assent in the absence of your correspondents? How do you share conviction?
Latour, Bruno (2008) Review Essay: The Netz-Works of Greek Deductions. In: Social Studies of Science 38, pp. 441–459. page 443.
¶ In the spring 2020 and more or less the rest of the year, diagrammatic visualisations were brought up at Corona-press conferences led by authorities as well as in the informational flows in online media. An abstract ride along a curve was imagined and evoked. This practice of curve surfing is one of the most central orientational concepts of modern society. A virus induced an epidemic of curve surfing. A practice that we can trace back to practices of formalism and mathematical deduction thousands of years ago. An imaginary about a common collective journey. Where are we heading, how will it be? We’re on a road to…? Surf’s up, catch the wave of change and ride along.
[1] The S-curve appear in Everett Rogers’ Diffusion of Innovations (1962), see the post: From Early Adopters to Early Alerters. Several innovation imaginaries evoke change as “the march of new technology”, disruption, technological evolution and “inexorable progress”. The way I address emerging technologies through ideas about mundanisation is however more aligned with ideas about temporal entanglements as discussed by Shannon Mattern in Code and Clay, Data and Dirt (2017). By combining methods from archeology and media-archeology she stress the importance of local variations of media, of different temporalities and evolutionary paths. This create methodological opportunities to study media that also “…necessitate an alternative means of writing history – one that looks beyond revolutions, Great Men’s accomplishments, origin stories, and reductive distinctions between “old” and “new””(Mattern 2017:xxviii) .
Version History
V. 1.1 June 6 2020. Added a paragraph about the suggestive power of charts and graphs. Added an image of diagram-templates, and a part in note 1 referring to Shannon Mattern and her methodological arguments about studying media. Smaller typographic adjustments.
V. 1.2. October 11 2020. Added a quote by Bruno Latour, in which he discusses cognitive tools for deduction, based on Reviel Netz studies of deduction in early greek mathematics.